Overview
DNA microarray technology provides us with a first step toward the goal of uncovering gene functions on a genome wide. To date, vast amount of gene expression data were collected in public database, such as the Gene Expression Omnibus (GEO). The PLANEX is a web-based tool for understanding gene function and network visualization. Pearson's correlation coefficient (PCCs, r-value) is used as a measure of gene co-expression. The comparison method of functional analysis was used with statistical significance based on the hypergeometric test. Retrieved gene expression data can then be viewed as a co-expression network with K-mean clustering and gene co-expression. The network analysis could provide insights into unknown functional relationships of the gene. The co-expression gene comparison method based on Cohen’s Kappa was employed for pattern matching approach with each co-expression gene. This analysis allows user find similar co-expression through different species.
Data source
All the microarray data were downloaded from public database NCBI GEO (1). The microarray probe data were retrieved from Affymetirx site (2). All the plant sequence data downloaded from public database Phytozome (3) and DFCI TGI (4).
Data processing
RMA (5) method provided by APT (Affymetrix Power Tools) (2) was used to convert Affymetrix probe level data to expression values. The sketch quantile method for normalization used and normalized expression values were log2 transformed.
Probe mapping
The homemade Perl script was use for probe mapping probe sequence vs gene sequence. This perl script is different from BLAST algorithm, because the BLAST algorithm allows mismatches and gaps within the query sequence to produce a positive alignment.
Co-expression analysis
The Pearson correlation coefficient (6) of two genes is calculated based on each Affymetrix microarray data after filtering low quality slides. "1" indicates strong relationship in an aspect of gene expression regulation, "0" indicates no relationship and "-1" indicates negative relationship. In order to build the co-expression genes, a r-value cutoff is needed to consider the pair of genes co-expressed. To choose an appropriate r-value cutoff , we examined the random sampling on each species. The link on summary table will show that a Pearson correlation coefficient distribution on the 2-fold random sample number of each microarray probes.
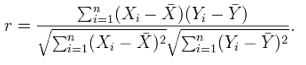
<Formula of Pearson correlation coefficient>
K-means clustering for network
The parallel K-means data clustering (7) was used for microarray clustering in threshold 0.001. Each clustered gene in a network appear as a node and r-value in the network is represented by an edge and each edge in network represent a cut-off (0.01). The network was visualized by Cytoscape web-tool.
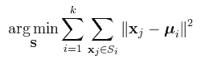
<Formula of K-mean clustering>
Enrichment test in Gene Ontology
A typical co-expression gene can generate many list of genes, each containing hundreds of genes of interest. To determine whether there is a common term to those genes, which will help interpretation of the experiment. We were used GOTermfinder (8), a tool for finding significant terms shared among a list of genes with statistics analysis based on hypergeometric test and False Discovery Rate (FDR;Benjamini test).
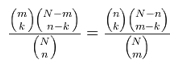
<Formula of Hypergeometric test>
<Formula of False Discovery Test>
Cohen’s Kappa for gene similarity test
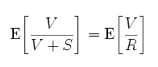
To measure the degree of the co-expression genes between two query genes, the Cohen’s Kappa (9) was used. The Kappa value was interpreted with each co-expression’s Pfam ID. The distance between co-expression genes were estimated using kappa statistics.
<Formula of Kappa statistics>
Summary of PLANEX and bulk data link
| GEO NCBI | No.of Samples | Normalization plot | Probe mapping | Random sampling plot | Cluster | Phytozome Annotation | TC Annoation | |
|---|---|---|---|---|---|---|---|---|
| Arabidopsis thaliana | GPL198 | 5502 | TSV | TSV | link | |||
| Glycine max | GPL4592 | 3080 | TSV | TSV | link | |||
| Hordeum vulgare | GPL1340 | 738 | TSV | TSV | link | |||
| Oryza sativa | GPL2025 | 884 | TSV | TSV | link | |||
| Solanum lycopersicum | GPL4741 | 253 | TSV | TSV | link | |||
| Triticum aestivum | GPL3802 | 451 | TSV | TSV | link | |||
| Vitis vinifera | GPL1320 | 738 | TSV | TSV | link | |||
| Zea mays | GPL4032 | 379 | TSV | TSV | link |
References
1. Domrachev,M. and Lash,A.E. (2002) Gene Expression Omnibus: NCBI gene expression and hybridization array data repository. Nucleic Acids Research, 30, 207 -210, 10.1093/nar/30.1.207.
2. The phytozome, http://www.phytozome.net/
3. Affymetrix, http://www.affymetrix.com/
4. The gene index project, http://compbio.dfci.harvard.edu/tgi/
5. Rafael. A. Irizarry, Benjamin M. Bolstad, Francois Collin, Leslie M. Cope, Bridget Hobbs and Terence P. Speed (2003), Summaries of Affymetrix GeneChip probe level data Nucleic Acids Research 31(4):e15
6. Soper,h.e., Young,a.w., Cave,b.m., Lee,a. and Pearson,k. (1917) On the distribution of the correlation coefficient in small samples. appendix ii to the papers of “student” and r. a. Fisher. a cooperative study. Biometrika, 11, 328 -413, 10.1093/biomet/11.4.328
7. The parallel K-means data clustering, http://users.eecs.northwestern.edu/~wkliao/Kmeans/
8. Boyle,E.I., Weng,S., Gollub,J., Jin,H., Botstein,D., Cherry,J.M. and Sherlock,G. (2004) GO::TermFinder--open source software for accessing Gene Ontology information and finding significantly enriched Gene Ontology terms associated with a list of genes. Bioinformatics, 20, 3710-3715, 10.1093/bioinformatics/bth456.
9. Cohen,J. (1960) A Coefficient of Agreement for Nominal Scales. Educational and Psychological Measurement, 20, 37-46.